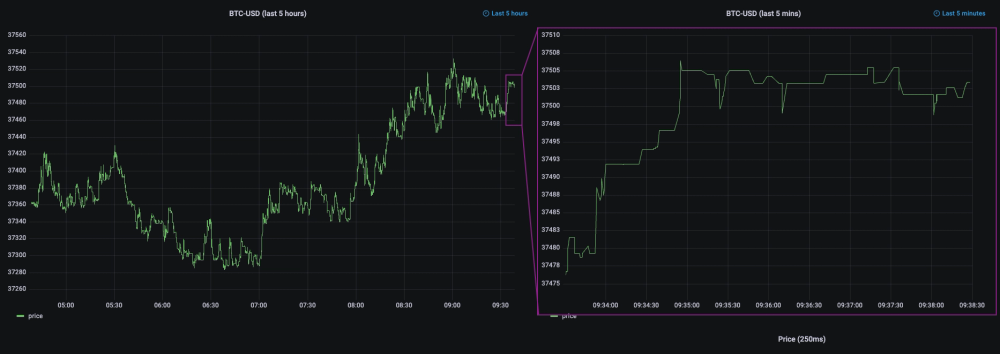
A nice thing about Grafana is seeing your dynamic dashboards refresh as data updates over time. However, to limit the load on the Grafana server both on the browser and on the underlying database, the maximum default refresh rate is once every 5 seconds. While this is certainly more than enough for some applications, in more real-time use cases such as financial market data, there is a latent need to always get always closer to realtime.
Conveniently, Grafana allows you to easily tweak server settings to allow for higher frequencies. But there's a catch. Whatever is sending data to your dashboard needs to accommodate your desired rate. Luckily, Questdb can support hyper-fast refresh rates. The end result is more up to date dashboard with smooth continuous-looking updates and that unparalleled feeling of realtime.
We recently built a series of financial market data dashboards that refresh at a very fast interval. This guide shows you how to do the same.
Why higher frequency
The first question to ask is whether this feature is useful for your use case. Here are some example reasons and scenarios where this can be useful.
It depends on the scale
There is little upside in having high refresh rate on large scale charts which span a few hours to a few days. But when you are looking at small intervals such as the last minute, last 5 minutes and so on, then a higher update frequency makes sense as the short term changes become much more visible.

Most up to date information
Often times you want to get updated information as soon as possible. Generally, if you are looking at prices, it's better to be looking at the latest price possible rather than at a price that's 5 seconds old. Whether it is material or not depends on your use case.
If you are actively trading using Grafana charts as a tool, for example to highlight arbitrage opportunities, then want the latest price as soon as possible. If you are using a Grafana dashboard to view the value of your portfolio, or some other non-time-sensitive metric then - strictly speaking - it's better to be closer to realtime, but not necessary.
Shorter feedback loop
Say you are working on a closed-loop system. For example, you change a parameter on your trading algo and you want to see the effect on derived metrics. Does that generate new trades? Does it change other linked parameters by propagation? And so on.
If your actions trigger reactions, then a more frequent update frequency reduces the latency in receiving feedback. If you make a mistake changing something, you can see it immediately instead of somewhere in the next seconds. In some cases, it may not make a difference, in others, it can be critical.
It's satisfying
It cannot be just me… There's a big difference between looking at a periodically updating dashboard versus a continuously updating one. Yes, strictly speaking, the dashboard is always updating periodically and we just reduce the update period...
However, when the period gets small, like one second and below, then it looks smooth and continuous. It's a bit like going from a small low definition 24 hz computer monitor to 4k 120hz. Sure, you can work using both. But one is much more comfortable and satisfying to use.
Configuring update frequencies for your use case
We'll review:
- how to tweak the default settings to add/remove options
- how to tweak the server configuration to allow even higher refresh frequencies than allowed by default
Default frequency choices
Grafana comes with a few default frequency options
- 1 day
- 2 hours
- 1 hour
- 30 minutes
- 15 minutes
- 5 minutes
- 1 minute
- 30 seconds
- 10 seconds
- 5 seconds
- off - you need to click the refresh data button manually to update
Tweaking default settings
Typically, your dashboard may not need all the above options. If you typically refresh once every 2 hours for example, then probably the 5 seconds interval is not useful, and vice versa.
Tweak these default options in the dashboard settings using the Auto refresh field:

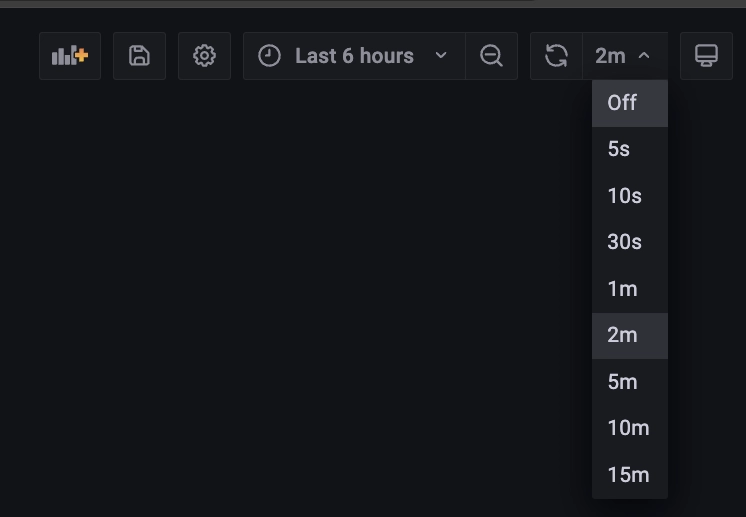
To change, add, remove frequencies to the list, simply edit the list of time intervals. For example, you may choose to remove anything over 10 minutes, and add a custom intervals such as every 2 minutes, every 10 minutes and so on. The resulting list would look like the following:

After saving your dashboard, the new settings are available in the dropdown:

Unleashing high frequency updates
While this works for frequencies up to 5 seconds, this approach does not work by default for anything below 1 second. If you try to add a frequency such as '1s' or '250ms', then you won't normally see them in the dropdown.
Here is an attempt with higher refresh rates below the standard maximum of once every 5 seconds:

Once we save the dashboard, the frequencies below 5s are not available in the dropdown:

This is because the Grafana server config grafana.ini has a setting called
_min_refresh_interval which by default is set to 5s. The default location for
this file is is /etc/grafana/grafana.ini. But it depends on your OS and setup.
If you need a locating it, checkout the
Grafana config docs.
############## Dashboards History #######

[dashboards]

# Number dashboard versions to keep (per dashboard).
# Default: 20, Minimum: 1
; versions_to_keep = 20

# Minimum dashboard refresh interval. When set, this
# will restrict users to set the refresh interval of a
# dashboard lower than given interval.
# Per default this is 5 seconds.
# The interval string is a possibly signed sequence
# of decimal numbers, followed by a unit
# suffix (ms, s, m, h, d), e.g. 30s or 1m.

; min_refresh_interval = 5s # !!

# Path to the default home dashboard.
# If this value is empty, then Grafana
# uses StaticRootPath + "dashboards/home. json"
; default_home_dashboard_path
However, you can set it to something else, for example 200ms.
############## Dashboards History #######

[dashboards]

# Number dashboard versions to keep (per dashboard).
# Default: 20, Minimum: 1
; versions_to_keep = 20

# Minimum dashboard refresh interval. When set, this
# will restrict users to set the refresh interval of a
# dashboard lower than given interval.
# Per default this is 5 seconds.
# The interval string is a possibly signed sequence
# of decimal numbers, followed by a unit
# suffix (ms, s, m, h, d), e.g. 30s or 1m.

min_refresh_interval = 200ms # Faster!

# Path to the default home dashboard.
# If this value is empty, then Grafana
# uses StaticRootPath + "dashboards/home. json"
; default_home_dashboard_path
Since the changes only take place upon restart, restart the Grafana instance. We can then setup our new frequencies in the dashboard settings.

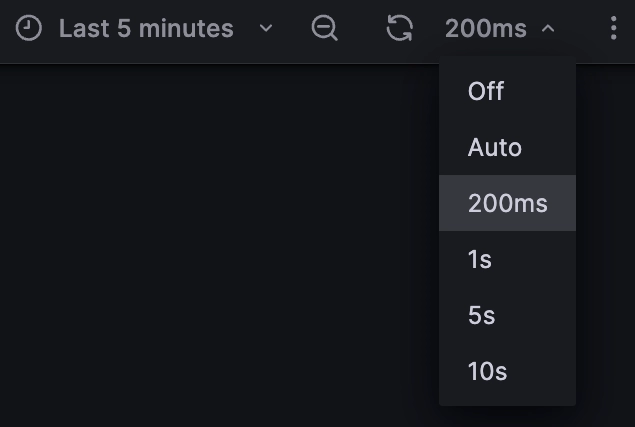
And this time, they are available in the list dropdown.

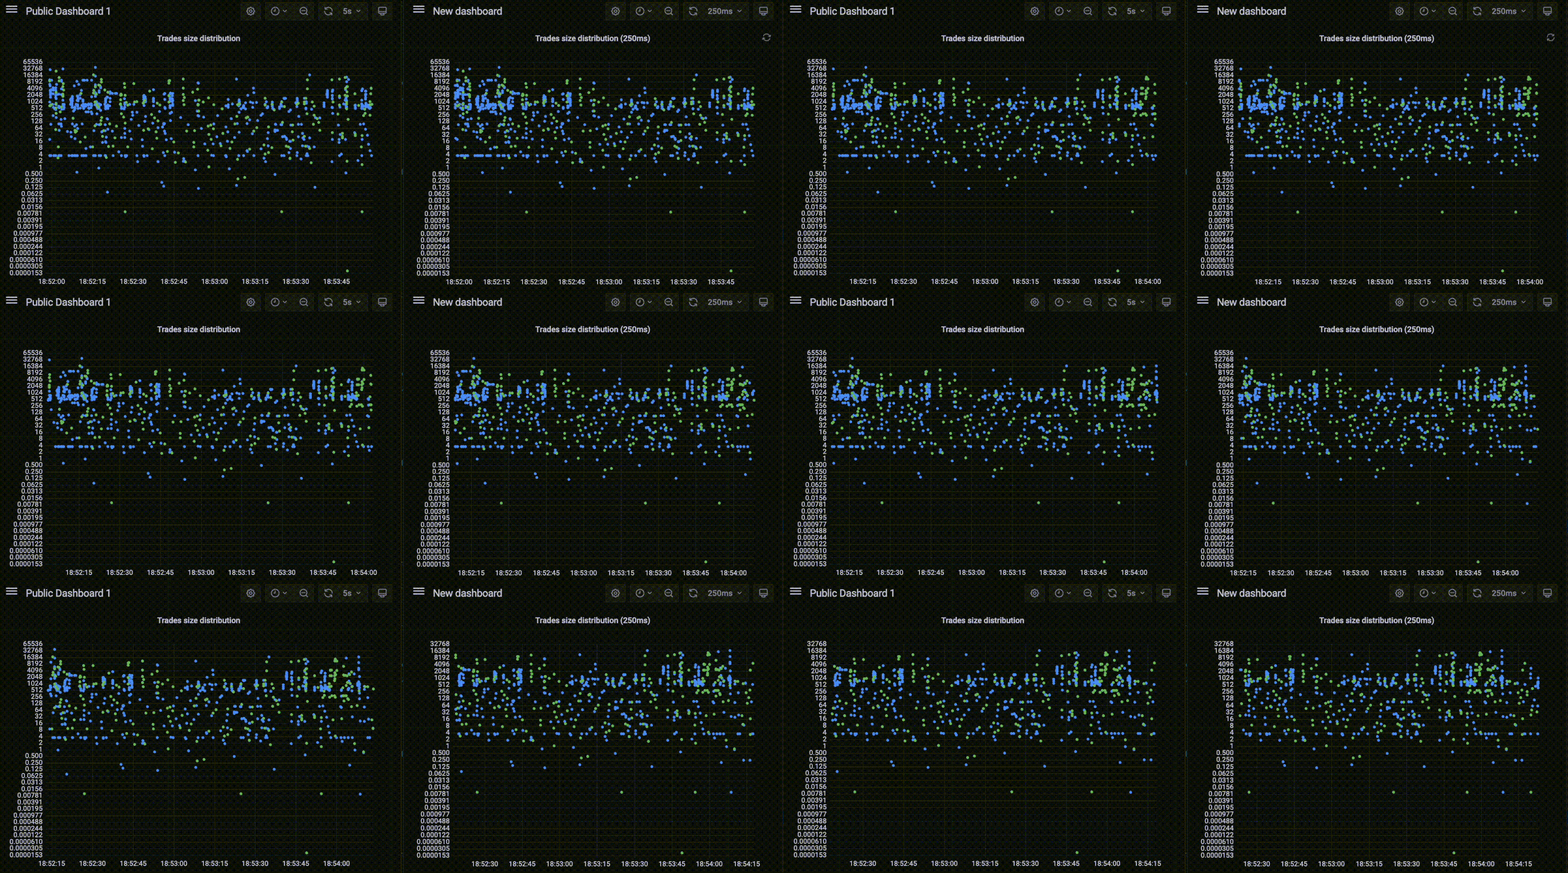
Finally, we can get our realtime charts going!

Thanks for reading.
Interested in more Grafana tutorials?
Check these out:
- Working with Grafana Map Markers
- Fluid real-time dashboards with QuestDB and Grafana
- Build your own resource monitor
- Tracking sea faring ships with AIS data and Grafana
- Visualizing real-time NYC cab data and geodata
- Increase Grafana refresh rate frequency
- Or checkout our Grafana blog tag